Yield Prediction Agent
Overview
The Yield Prediction Agent is responsible for predicting crop yield based on weather data and crop type. The agent leverages multiple machine learning models to ensure accuracy, including Linear Regression, Decision Tree, Random Forest, and XGBoost. The best model is selected based on performance metrics such as R2 and Mean Squared Error (MSE).
Agent Pipeline
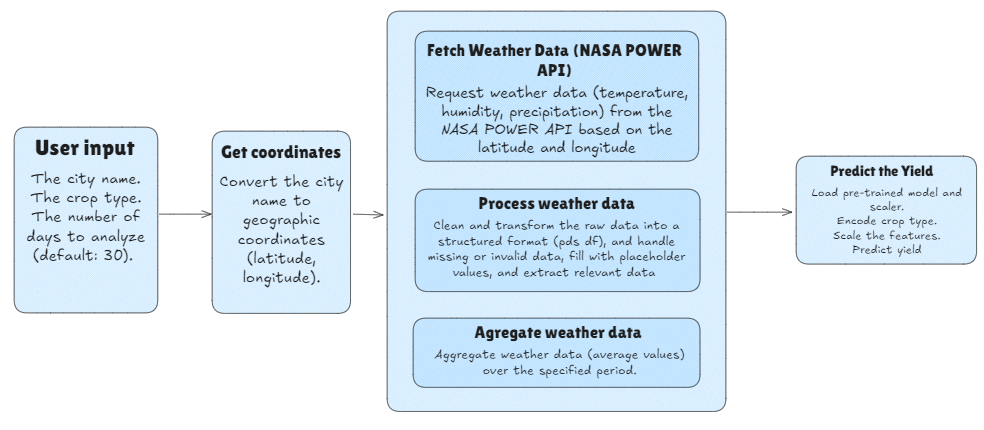
The following diagram explains the agent:
Training Process
The training process follows these steps:
Load the Dataset: The dataset containing crop yield data and related weather variables is loaded for preprocessing.
Preprocess the Data: - Categorical Encoding: The crop type is encoded using Label Encoding. - Feature Scaling: Weather-related features like temperature, precipitation, and humidity are scaled to ensure consistency across models.
Split the Dataset: The data is split into training and testing sets (80-20 split).
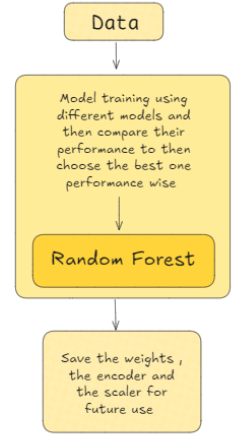
Model Training: Multiple models are trained on the data: - Linear Regression - Decision Tree Regressor - Random Forest Regressor - XGBoost Regressor
Model Evaluation: Each model is evaluated using performance metrics, particularly R2 and MSE.
Select the Best Model: The best-performing model is selected based on the R2 score and saved along with the label encoder and scaler.
Save the Best Model: The selected model, encoder, and scaler are saved as pickle files for later use in predictions.
Training Diagram
The following diagram explains the training process:
Prediction Workflow
Once the best model is selected and saved, the prediction workflow proceeds as follows:
Input: The user provides the city name and crop type.
Data Fetching: The agent fetches weather data from the NASA POWER API based on the city’s latitude and longitude.
Data Processing: - The weather data is processed to extract relevant features. - The crop type is encoded, and numerical features are scaled.
Prediction: The best model (selected during training) is used to predict the crop yield based on the processed data.
Output: The predicted crop yield is returned to the user.
Model Performance Metrics
The performance of the models is evaluated using two metrics:
Mean Squared Error (MSE): A measure of how well the model’s predictions match the actual values.
R2 Score: A statistical measure that indicates the proportion of the variance in the dependent variable that is predictable from the independent variables.
Best Model: Random Forest
The Random Forest model was selected as the best model based on the highest R2 score achieved during the evaluation phase.
Weather Data Fetching and Crop Yield Prediction
This section describes the Python code used to fetch weather data and process it for crop yield prediction.
Imports and Dependencies
The necessary libraries for weather data fetching, geolocation, and machine learning are imported at the beginning. These include requests, pandas, geopy, and joblib.
import requests
import pandas as pd
from datetime import datetime, timedelta
from geopy.geocoders import Nominatim
from geopy.exc import GeocoderTimedOut
import joblib
import time
from requests.adapters import HTTPAdapter
from requests.packages.urllib3.util.retry import Retry
Geolocation and Coordinate Fetching
The get_coordinates function retrieves the latitude and longitude of a given city name using the geopy library. It handles retries in case of timeouts from the geocoding service.
def get_coordinates(city_name, max_retries=3, timeout=5):
    for attempt in range(max_retries):
        try:
            geolocator = Nominatim(user_agent="weather_data_fetcher", timeout=timeout)
            location = geolocator.geocode(city_name)
            if location is None:
                raise ValueError(f"Could not find coordinates for {city_name}")
            return location.latitude, location.longitude
        except GeocoderTimedOut:
            if attempt == max_retries - 1:
                raise TimeoutError(f"Geocoding service timed out after {max_retries} attempts.")
            print(f"Timeout on attempt {attempt + 1}/{max_retries}. Retrying...")
            time.sleep(2)
Creating a Robust Requests Session
The create_requests_session function sets up a session with automatic retries for handling common HTTP errors such as 429 (Too Many Requests) and 500 (Internal Server Error).
def create_requests_session():
    session = requests.Session()
    retry_strategy = Retry(
        total=3,
        backoff_factor=1,
        status_forcelist=[429, 500, 502, 503, 504],
    )
    adapter = HTTPAdapter(max_retries=retry_strategy)
    session.mount("http://", adapter)
    session.mount("https://", adapter)
    return session
Fetching NASA POWER Data
The fetch_nasa_power_data function uses the NASA POWER API to fetch weather data for a given location (latitude and longitude) and date range. It retrieves parameters such as temperature, relative humidity, precipitation, and specific humidity.
def fetch_nasa_power_data(latitude, longitude, start_date, end_date):
    base_url = "https://power.larc.nasa.gov/api/temporal/daily/point"
    parameters = [
        "T2M",          # Temperature at 2 Meters
        "RH2M",         # Relative Humidity at 2 Meters
        "PRECTOTCORR",  # Precipitation Corrected
        "QV2M"          # Specific Humidity at 2 Meters
    ]
    params = {
        "start": start_date,
        "end": end_date,
        "latitude": latitude,
        "longitude": longitude,
        "community": "AG",
        "parameters": ",".join(parameters),
        "format": "JSON"
    }

    session = create_requests_session()
    try:
        response = session.get(base_url, params=params, timeout=30)
        response.raise_for_status()
        return response.json()
    except requests.exceptions.RequestException as e:
        print(f"Error fetching NASA POWER data: {e}")
        raise
Processing the Weather Data
The process_nasa_data function extracts and processes the weather data returned by the NASA API, converting it into a pandas DataFrame. Invalid or missing values are handled.
def process_nasa_data(data):
    try:
        parameter_data = data['properties']['parameter']
        fill_value = data['header']['fill_value']
        daily_data = []

        for date in parameter_data['T2M'].keys():
            if parameter_data['T2M'][date] != fill_value:
                daily_values = {
                    'Temperature at 2 Meters (C)': parameter_data['T2M'][date],
                    'Precipitation (mm day-1)': parameter_data['PRECTOTCORR'][date],
                    'Specific Humidity at 2 Meters (g/kg)': parameter_data['QV2M'][date],
                    'Relative Humidity at 2 Meters (%)': parameter_data['RH2M'][date]
                }
                daily_data.append(daily_values)

        if not daily_data:
            print("No valid data found.")
            return None

        return pd.DataFrame(daily_data)
    except KeyError as e:
        print(f"Error processing data: {str(e)}")
        raise
Aggregating the Data
The aggregate_weather_data function calculates the average weather parameters (temperature, precipitation, humidity) over the provided period to provide a summarized weather overview for crop yield prediction.
def aggregate_weather_data(df):
    aggregated = pd.DataFrame([{
        'Temperature at 2 Meters (C)': df['Temperature at 2 Meters (C)'].mean(),
        'Precipitation (mm day-1)': df['Precipitation (mm day-1)'].mean(),
        'Specific Humidity at 2 Meters (g/kg)': df['Specific Humidity at 2 Meters (g/kg)'].mean(),
        'Relative Humidity at 2 Meters (%)': df['Relative Humidity at 2 Meters (%)'].mean()
    }])
    return aggregated
Predicting Crop Yield
The predict_crop_yield function combines the fetched weather data with a pre-trained machine learning model (random forest). It uses the weather data and crop type to make a prediction on crop yield.
def predict_crop_yield(city_name, crop_type, days=30):
    try:
        # Load the saved model, encoder, and scaler
        model = joblib.load("random_forest_model.pkl")
        label_encoder = joblib.load("crop_encoder.pkl")
        scaler = joblib.load("crop_scaler.pkl")

        # Define the required column order
        column_order = [
            "Crop",
            "Precipitation (mm day-1)",
            "Specific Humidity at 2 Meters (g/kg)",
            "Relative Humidity at 2 Meters (%)",
            "Temperature at 2 Meters (C)"
        ]

        # Get latitude and longitude
        latitude, longitude = get_coordinates(city_name)

        # Fetch and process weather data
        end_date = datetime.now()
        start_date = end_date - timedelta(days=days)
        nasa_data = fetch_nasa_power_data(latitude, longitude, start_date.strftime('%Y%m%d'), end_date.strftime('%Y%m%d'))
        daily_weather = process_nasa_data(nasa_data)
        aggregated_weather = aggregate_weather_data(daily_weather)

        # Add encoded crop type
        crop_encoded = label_encoder.transform([crop_type])[0]
        aggregated_weather.insert(0, 'Crop', crop_encoded)

        # Ensure correct column order
        aggregated_weather = aggregated_weather[column_order]

        # Scale numerical features (excluding 'Crop')
        numerical_columns = column_order[1:]  # Exclude 'Crop'
        aggregated_weather[numerical_columns] = scaler.transform(aggregated_weather[numerical_columns])

        # Make prediction
        predicted_yield = model.predict(aggregated_weather)
        return predicted_yield[0]

    except Exception as e:
        print(f"Error during prediction: {str(e)}")
        return None
Main Program
In the __main__ section, the program continuously prompts the user for input, including the city name, crop type, and the number of days to analyze. It then displays the predicted crop yield.
if __name__ == "__main__":
    print("Crop Yield Prediction System")
    print("-" * 30)

    while True:
        city_name = input("\nEnter city name (or 'quit' to exit): ").strip()
        if city_name.lower() == 'quit':
            break

        # Show available crop types
        try:
            label_encoder = joblib.load("crop_encoder.pkl")
            valid_crops = list(label_encoder.classes_)
            print(f"\nAvailable crop types: {valid_crops}")
        except Exception as e:
            print("Error loading crop types:", e)
            continue

        crop_type = input("Enter crop type: ").strip()
        if crop_type not in valid_crops:
            print(f"Invalid crop type. Please choose from: {valid_crops}")
            continue

        days = input("Enter number of days to analyze (default 30): ").strip()
        days = int(days) if days.isdigit() else 30

        print("\nProcessing request...")
        predicted_yield = predict_crop_yield(city_name, crop_type, days)

        if predicted_yield is not None:
            print(f"\nPredicted yield for {crop_type} in {city_name}: {predicted_yield:.2f}")

        print("\nWould you like to make another prediction?")